

Retina Insights app for iPhone and iPad
First release : 21 Mar 2018
App size: 0 Bytes
Retina Insights is designed for health care practitioners treating the retinal diseases AMD, RVO and DME. The aim of Retina Insights is to visualize a DME, RVO or AMD patient’s disease condition over time.
User Guide.
First time use.
Set your user profile and select a username and password for future login. Read and accept the terms and conditions. Decide on BCVA measurement to use, either decimal or ETDRS letter.
Repeated usage:
1. Select “New patient” from the menu.
2. Enter the following patient data
a. Name / Initials
b. Personal number (optional)
c. Diagnosis
d. Left/right eye
e. Save the data
3. The “My Patients” page displays the patient/s you have entered.
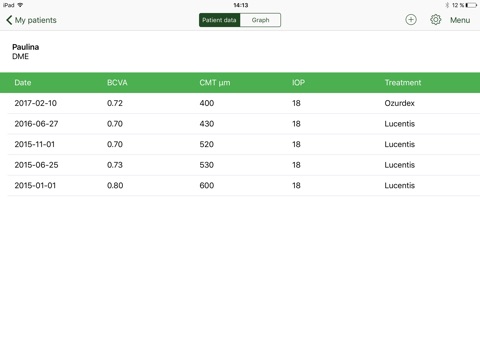
4. In order to view and enter patient data – press on “View >”.
5. Tap the plus-sign in the right corner to enter data:
a. BCVA – value (either ETDRS letter or decimal as previously decided)
i. For ETDRS you can enter values between 1-85
ii. For decimal you can enter values between 0.01-1.00
b. CMT – value in micrometer
c. IOP – value in mmHg
d. Date of visit (todays date is default)
e. Treatment (leave blank if no IVT was given)
f. Intervention (leave blank if no intervention besides IVT was carried out)
g. Save the data
6. To edit data, press on a specific visit date and the pop-up window for data entry appears, making it possible to edit previously entered data.
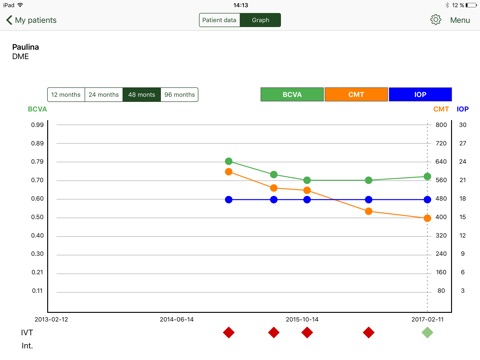
7. In order to view the graph with CMT, BCVA and IOP-data over time, press the “Graph”-button at the top center position of the page.
8. The specific patient data is displayed. The BCVA data will be shown in green dots and lines and with the BCVA axis to the left. Likewise, the CMT data and lines will be displayed in orange, with the axis to the right. The IOP data will be displayed in blue colour with the axis to the right.
You can select / deselect BCVA, CMT and IOP. Also, you can choose the time period to be displayed by choosing 12, 24, 48 or 96 months.
The IVT for each visit will be shown below the x-axis in different coloured circles for the individual IVT:s given. You can press on the circle to find out what IVT it corresponds to. Also, the interventions will be displayed under the x-axis.
9. For a display of your patient data as a group, go to the Menu on the top right corner and select “Treatment outcome DME patients”. You will now view a table that displays all your patient’s data in a group format.